Help and Resources
Historical Analytics
Trendsmap Historical Analytics enables you to analyse any topics from the July 23 back to 10 years ago. Some of the main features include:
- Analyse any topic using powerful boolean queries
- Filter results by time, country, state, region and language
- Learn how many tweets discuss a topic, and identify which are the most popular
- Find out where has the highest proportion of people discussing the topic
- Get unique insights such as gender of accounts
- See what are the most popular emojis related to any topic
- Identify who are the biggest influencers for any topic
- Discover the tweets that started a trend
There are a number of controls (listed below) which allow you to filter the results in many ways such as by location, time and with boolean queries.
Start Page
You can create an initial search by using the following filters.
- Query – You can use boolean queries (eg OR, and Proximity to fine-tune your searches. Click here to see what boolean operators are available.
- Dates – You can filter using preset timeframes, such as the last 12 hours, or use the Custom option to select your own start and end time. Please note that times are in UTC.
- Country – Simply select a particular country, or leave as All. Once you select a country you can also select a particular State, or leave as All. You can also leave the query section blank and just enter Country if you are interested in what is happening generally across the country of interest.
- Language – Simply select a particular language, or leave as All.

Results Page
The Analytics results provides you with statistics, maps showing activity, and the results in terms of top tweets, related hashtags, emojis.
There is also a Region filter, which you can use to select a particular area on the map, and then filter results to just that area.
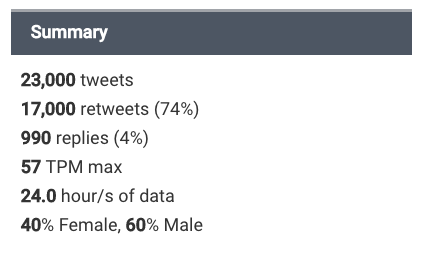
Summary
The summary gives you an estimate of the key statistics for the query.
- Tweets – The estimated number of tweets
- Retweets – The estimated number and percentage of retweets
- Replies – The estimated number and percentage of replies
- TPM Max – The maximum Tweets Per Minute (TPM) within that period
- Gender – An estimation of the percentage of females and males that have sent tweets that match that query
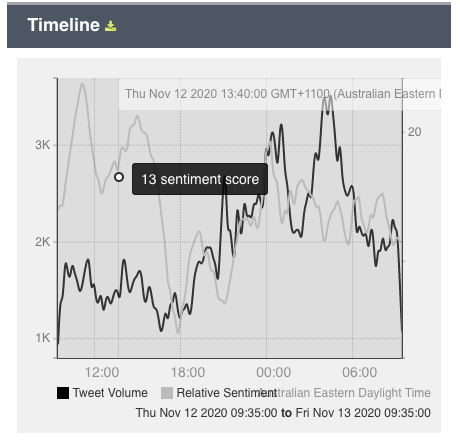
Timeline
The timeline shows how the volume of tweets changes over time.
Map
The map has various layers displaying choropleths and a heatmap. You can choose to display multiple layers at the same time.
-
Conversation – This shows the countries that are talking about the topic the most (darker) and the least (lighter) as a proportion of their overall conversation. If a country filter is used then it will show this on a State basis. The figures that are used in the scale are ‱, which is known as a basis point, or permyriad. This refers to 1/100ths of 1%, or per 10,000. For example 1‱ = 0.01%
-
Heatmap – This displays a heatmap of where tweets are coming from.

Further Statistics
There are further statistics for each query:
-
Conversation – This shows the countries that are talking about the topic the most (darker) and the least (lighter) as a proportion of their overall conversation. If a country filter is used then it will show this on a State basis. The figures that are used in the scale are ‱, which is known as a basis point, or permyriad. This refers to 1/100ths of 1%, or per 10,000. For example 1‱ = 0.01%
-
Country – This shows the countries where the most tweets are coming from, and the percentage of tweets from each country
-
City – This shows the cities where the most tweets are coming from, and the percentage of tweets from each city
-
Languages – The shows the most popular languages used in the tweets, and the percentage of tweets from each language
-
Hashtags – This shows the hashtags that are used most often in the tweets, and the percentage of tweets containing each hashtag
-
Words – This shows the words that are used most often in the tweets, and the percentage of tweets containing each word
-
Emojis – This shows the emojis that are used most often in the tweets, and the percentage of tweets containing each emoji
-
Source apps – This shows the applications that have been used most often to send the tweets, and the percentage of tweets coming from each app
Tweets and Media
For all tweets and media in this section we provide an abbreviated version of the tweet so that as many tweets as possible are easily scannable.
You can see the full text of a tweet by hovering over the tweet, or by clicking on the tweet which will open a lightbox containing the original tweet. You can then easily scroll through all tweets within the lightbox.
You can retweet, reply, favorite and follow from within the lightbox. Also the time link (eg “about 2 hours ago”), links back to the original tweet on Twitter.
- Top retweets – These are the tweets that are retweeted the most
- Most quoted tweets – These are the tweets that are quoted the most
- Most replied tweets – These are the tweets that are replied to the most
- Most influencing tweets – These are the tweets from the accounts with the most followers
- Most recent tweets – These are the most recent tweets
- Top accounts – The accounts who are mentioned the most