Historical Twitter Analytics
Our historical analysis tool allows you to find out more about activity on Twitter from over the last ten years of its existence. Our tool uses data sampled from the end of May 2013 right through to mid July 2023.
Our historical analysis tool allows you to find out more about activity on Twitter from over the last ten years of its existence. Our tool uses data sampled from the end of May 2013 right through to mid July 2023.
This tool uses a dataset of nearly 20 billion tweets from over ten years. Representing around 1% of all tweets from this period, this allows you to analyse any topic efficiently based upon your specific time period and region of interest.
Journalists can delve into the historical tapestry of tweets to reveal trends, trace narratives, and fact-check with confidence, providing a comprehensive perspective for compelling storytelling.
Researchers can leverage our platform to conduct sociological, linguistic, and cultural studies with customizable datasets, fostering data-driven research and contributing groundbreaking insights to their disciplines.
Investigators can follow the digital trail, cross-reference information, and uncover hidden connections critical to their work. Historical Analytics becomes an indispensable tool for efficient and effective investigative operations.
Marketers can analyze historical Twitter data to understand audience sentiment, track campaign success over time, and fine-tune strategies based on past trends and user behavior.
Find the tweets that represent your topic of interest, filter out false positives, and focus in on your area and language of most interest.
Use complex Boolean expressions to get exactly what you want
Over 20 billion tweets are available. Data from July 23 back to 2013.
Filter by region, full language support, recent and custom date ranges to assist you to get more actionable results from the segment you need.
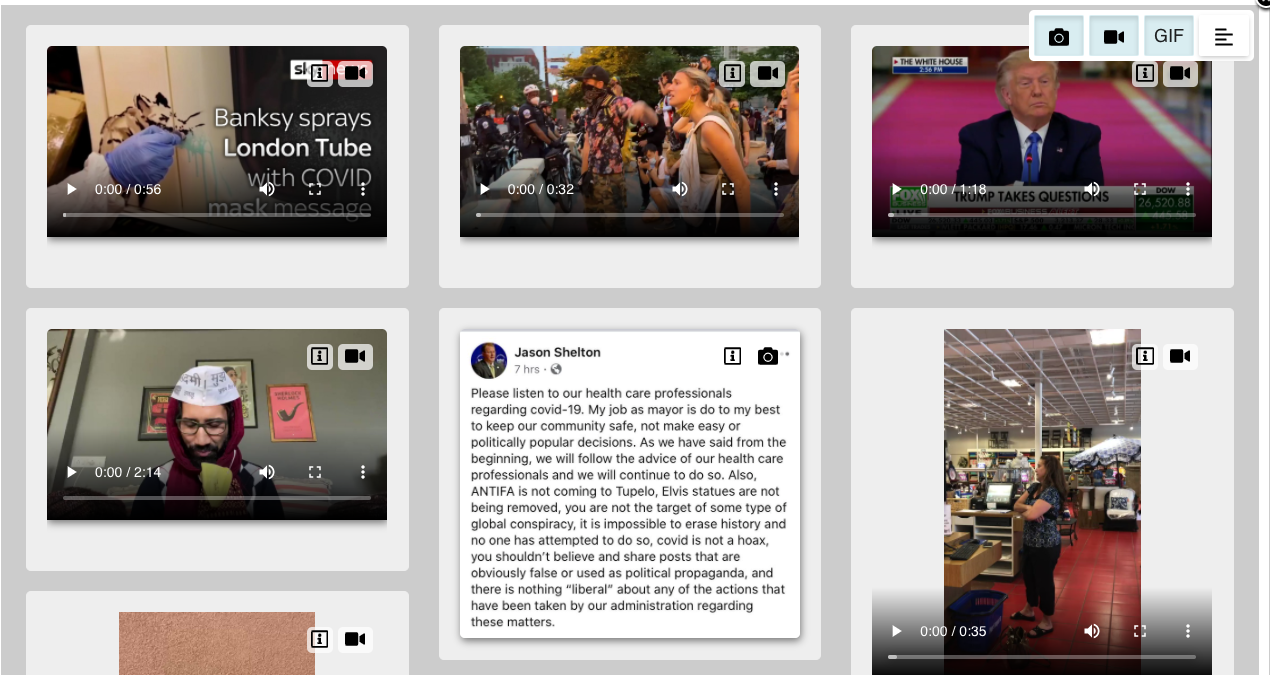
Images, videos and emojis provide additional insights
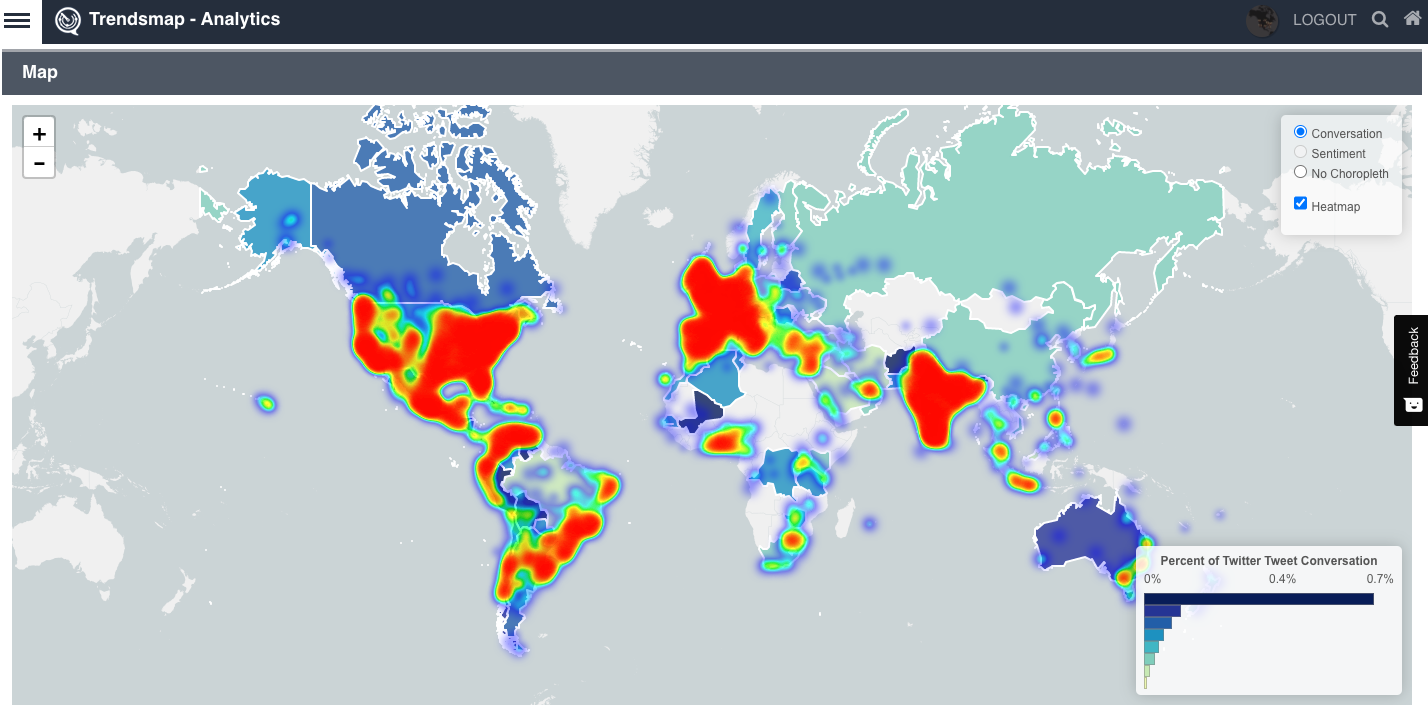
A pannable, zoomable map showing multiple geographical representations of your topic. Focus on your specific region or look at the world
See where your topic/hashtag is tweeted about around the globe
See where the conversation means the most to people on Twitter, and not just where the most tweets are coming from
Gain insights on number of tweets, retweets, maximum tweets per minute (TPM), percentage of gender split for tweets and more.
Our Historical Pro subscription allows you to download your results into your preferred spreadsheet program to delve deeper based on your requirements. This includes estimated tweet counts
See what applications the tweets are coming from. See if tweets are from iPhone or Android, desktop or mobile, or one of the many third party applications.
Find out not only the top tweet content around your topic, but also the top users, and the biggest influencers.
Learn which tweets are the most popular, influential, replied to or quoted
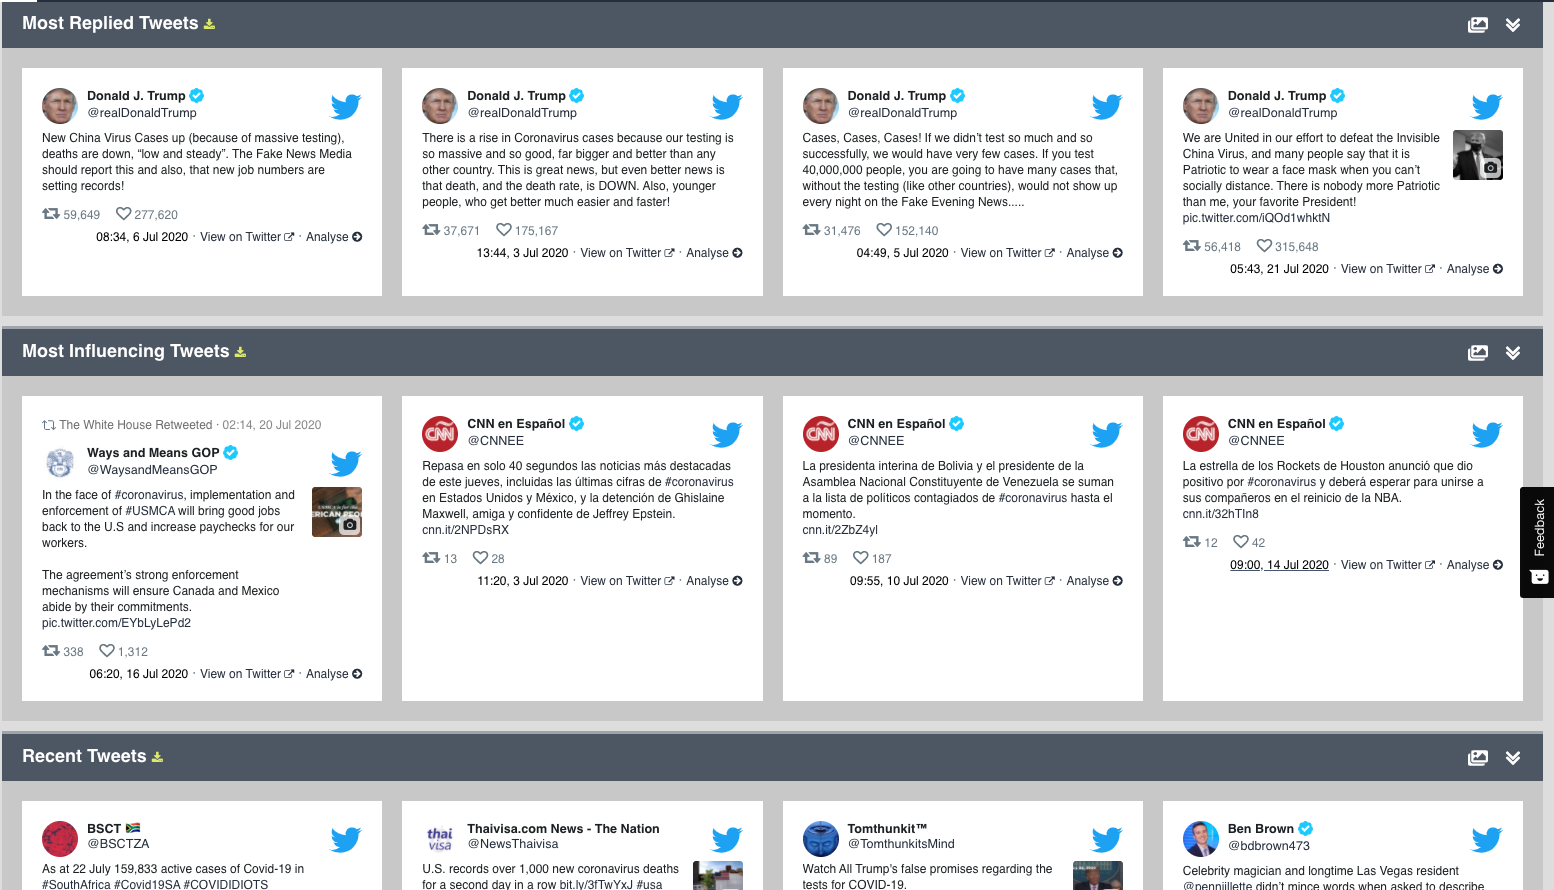
Find detailed information on:
Most retweeted, quoted, replied and influencing
See the most recent activity, as well as find the tweets where a topic started
Focus on media and links by browse through a gallery of just the media relating to a topic. Filter by type to find great photos, viral GIFs and amazing videos.
Our subscriptions differ by the length of days available for queries, the timeframe of data as well as the number of reports that you can create.
Queries:
Queries allow you to search the dataset to determine whether your search terms are producing results and over what time frame. You can do unlimited queries over short periods (1, 2 and 5 days). These queries will provide results quickly and allow you to refine your search terms and timeframes. You can also use Topic Search and Topic Trends to help refine your search terms.
Reports:
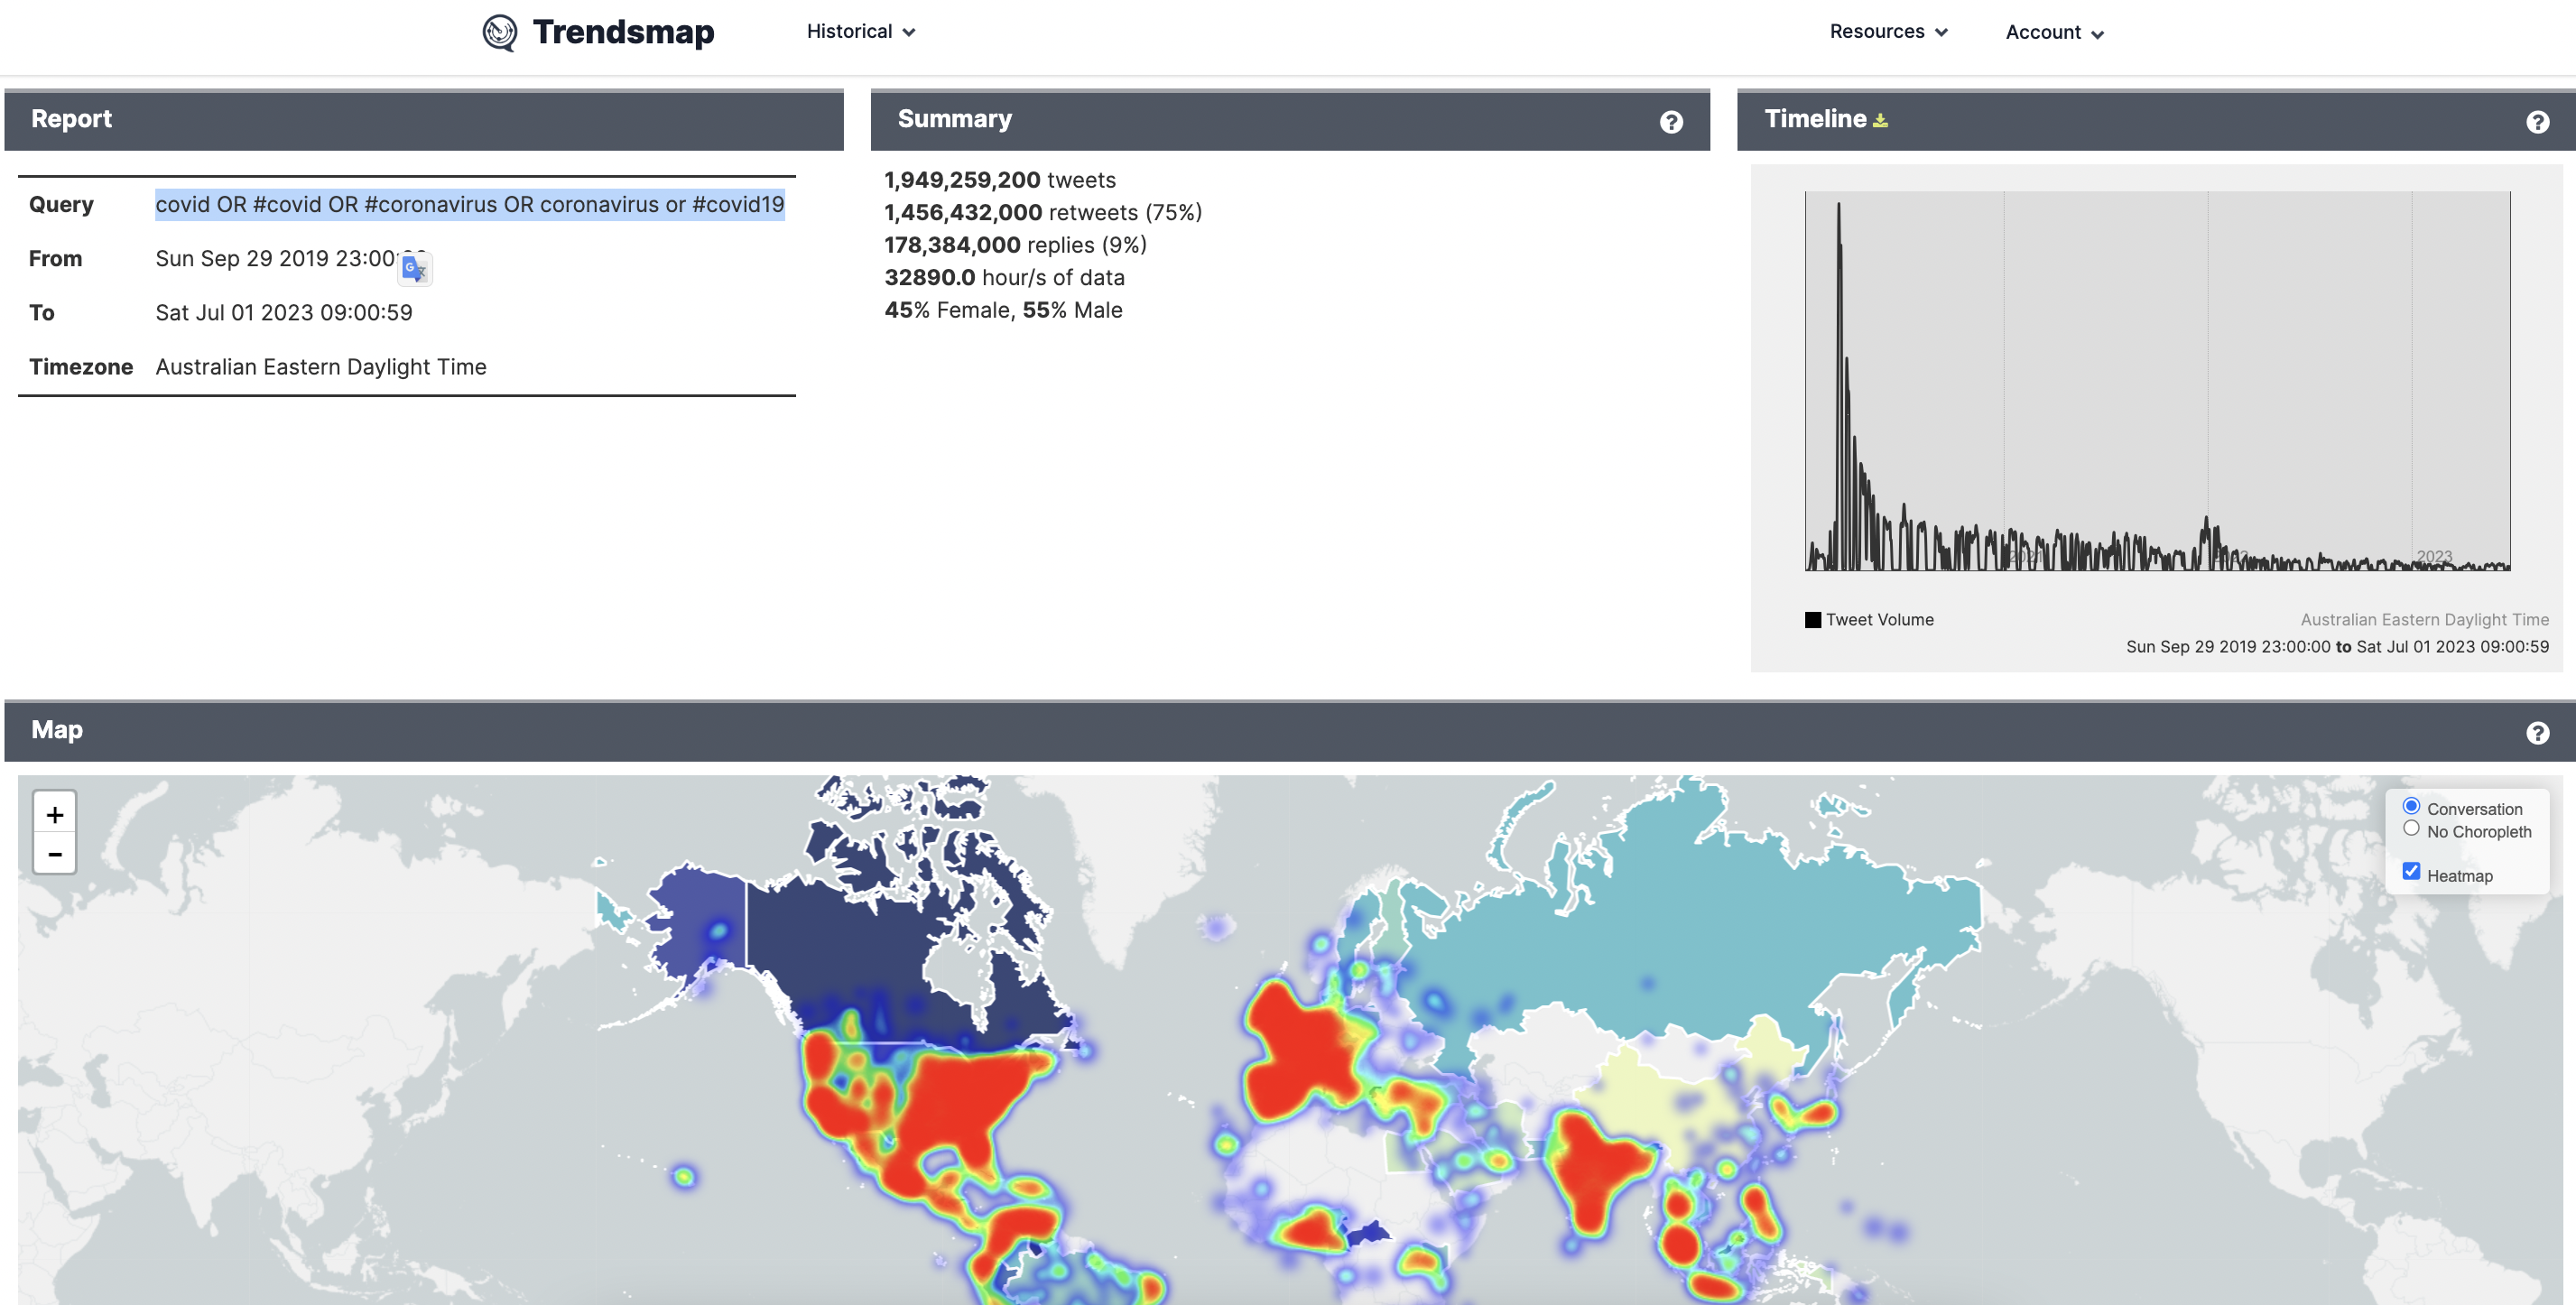
These are new to Trendsmap and allow you to produce a full analysis of your chosen search term of up to 1, 2 and 5 years. These reports are fully shareable with colleagues and will always reload instantly if you wish to review them again. Reports are limited (Analytics and Vis) and the number you get per month is dependent upon your subscription level. You can always upgrade or renew early if you need more. They will be stored in your account for reference. Reports take longer to load. Please be patient as the database is searching around 500 billion tweets!
Here as and example of a report with the query ‘#covid OR covid OR #coronavirus OR coronavirus OR #covid19’ from the start of covid in Sept 2019 until July 23 here