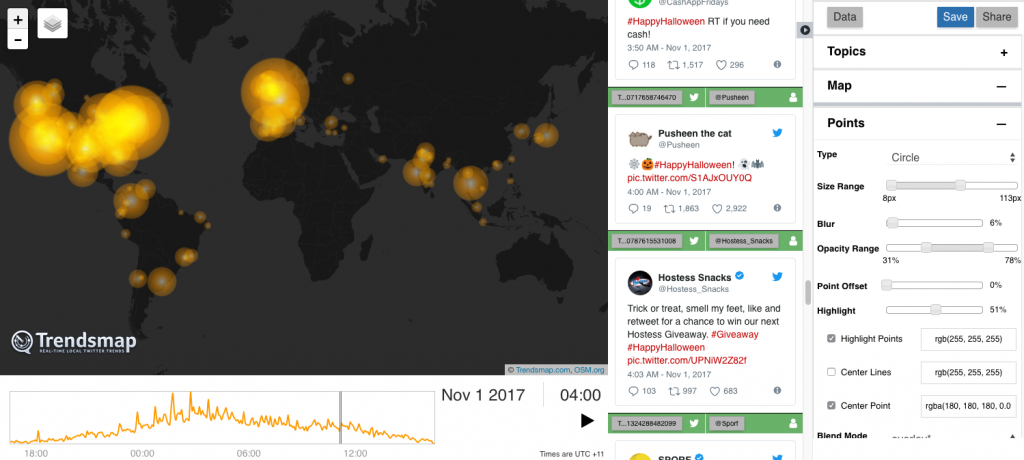
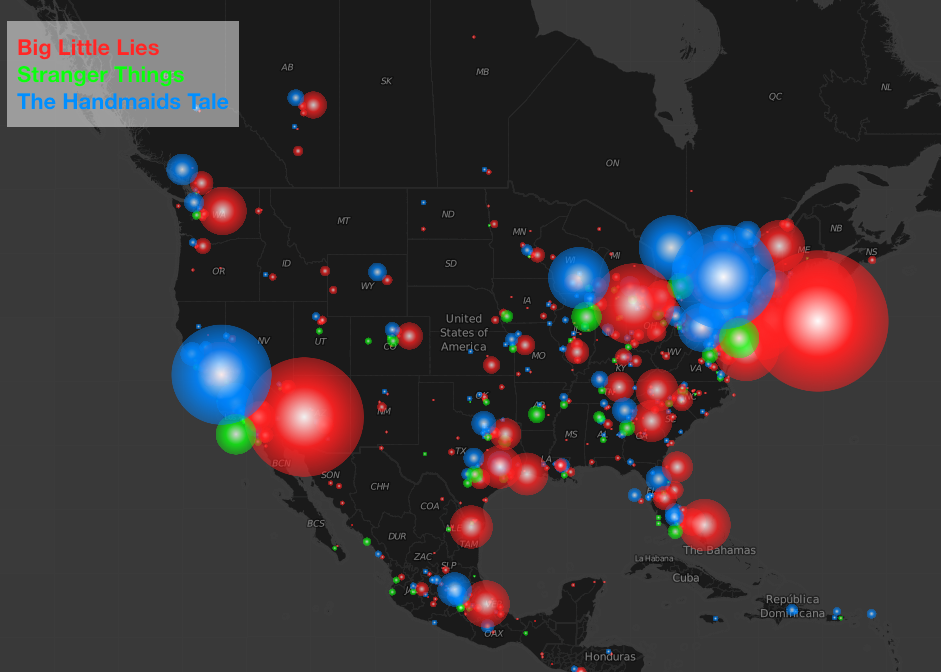
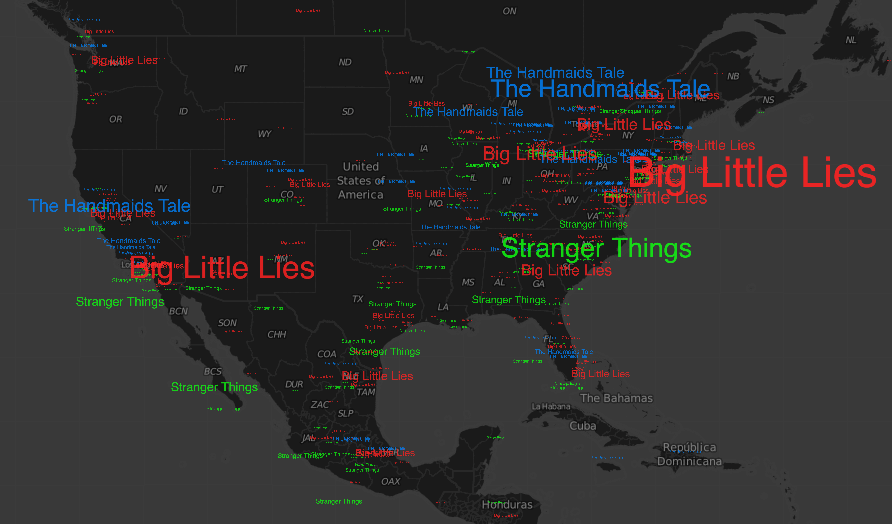
Visualisations
Need to show the spread of your hashtag or topic in an engaging way? Create unique visualisations to share with your team, for broadcast or to display on your website.
Advanced controls allow you to completely customise the visualisation display to suit your needs.
Simply show the map displaying your topic or you can show more information such as combination of map, chart data and top tweets
Control the length, speed and outlook of the animation
Compare two brands or hashtags to see the difference in popularity across a region or the world
Use words, emojis, and profile images to help immediately indicate to the viewer what it is about.